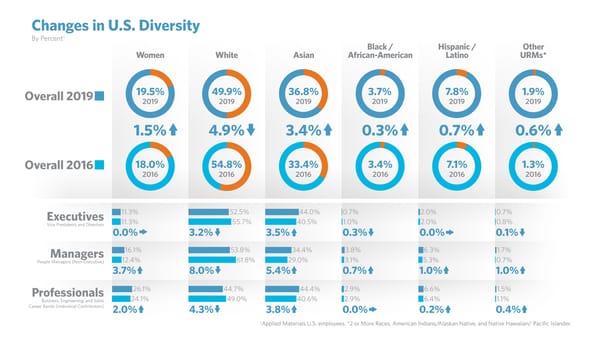
Changes in U.S. Diversity † By Percent Black / Hispanic / Other Women White Asian African-American Latino URMs* Overall 2019 19.5% 49.9% 36.8% 3.7% 7.8% 1.9% 2019 2019 2019 2019 2019 2019 1.5% 4.9% 3.4% 0.3% 0.7% 0.6% Overall 2016 18.0% 54.8% 33.4% 3.4% 7.1% 1.3% 2016 2016 2016 2016 2016 2016 Executives 11.3% 52.5% 44.0% 0.7% 2.0% 0.7% Vice Presidents and Directors 11.3% 55.7% 40.5% 1.0% 2.0% 0.8% 0.0% 3.2% 3.5% 0.3% 0.0% 0.1% Managers 16.1% 53.8% 34.4% 3.8% 6.3% 1.7% People Managers (Non-Executive) 12.4% 61.8% 29.0% 3.1% 5.3% 0.7% 3.7% 8.0% 5.4% 0.7% 1.0% 1.0% Professionals 26.1% 44.7% 44.4% 2.9% 6.6% 1.5% Business, Engineering, and Sales 24.1% 49.0% 40.6% 2.9% 6.4% 1.1% Career Bands (Individual Contributors) 2.0% 4.3% 3.8% 0.0% 0.2% 0.4% † Applied Materials U.S. employees. *2 or More Races, American Indians/Alaskan Native, and Native Hawaiian/ Pacific Islander.
 Changes in Diversity 2016 - 2019 Page 2 Page 4